|
|
Fig3101 |
Phosphorylation and Guanine-nucleotide Exchange Monitors
Version 9.0 released in October 21st, 2020.
Laboratory of Bioimaging and Cell Signaling, Graduate School of Biostudies; Department of Pathology and Biology of Diseases, Graduate School of Medicine, Kyoto University
Correspondence: Miki Matsuda; E-mail: matsuda.michiyuki.2c (atto) kyoto-u.ac.jp
Of course we know (although sometimes pretend not to know) that cells on the plastic dishes are totally different from those in living organisms. In the era of biochemistry and molecular biology, however, we needed a mass of homogenous cells for the detailed analysis of the molecule of interest and had to use cells on the dishes. Cell lysis, which is the first step of most biochemical and molecular-biological techniques, inevitably discards spatio-temporal information of the molecule of interest. To challenge this problem, we started to develop techniques to monitor the activity of signaling molecules. With this backgrounds in minds, in 1998 we started to develop monitors for spatio-temporal information on intracellular signaling. Since our immediate goal was to develop monitors for kinases and G proteins, two key players of the signal transduction, we named this project Phosphorylation and Guanine-nucleotide Exchange Monitoring Project (PHOGEMON Project). In 2001, we reported three monitors for Ras, Rap1, and CrkII and started distributing these PHOGEMONs. Because there are many technical hurdles that the PHOGEMON users will face when attempting to visualize intracellular signaling events, and because the probes and the techniques are under continual improvement, we are presenting our manual on the web and will keep updating it. We hope our PHOGEMON will attract many scientists who wish to see live images of cellular signaling.
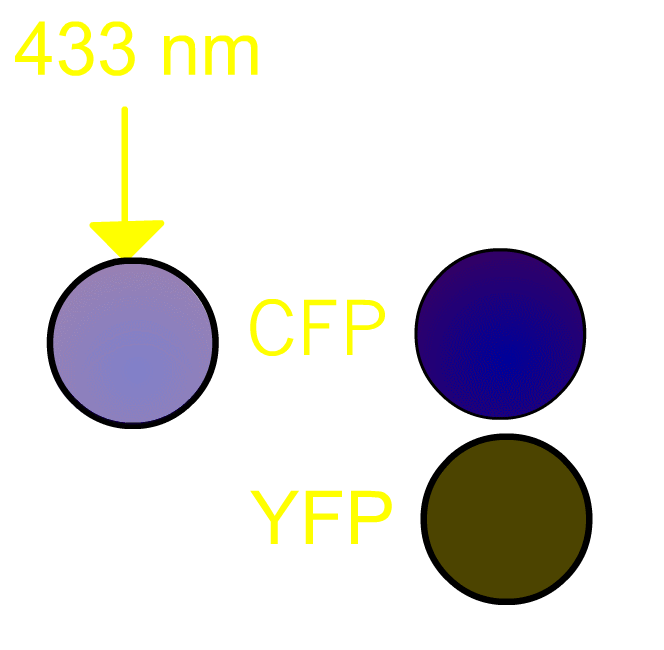
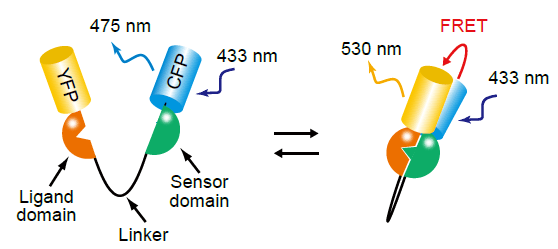
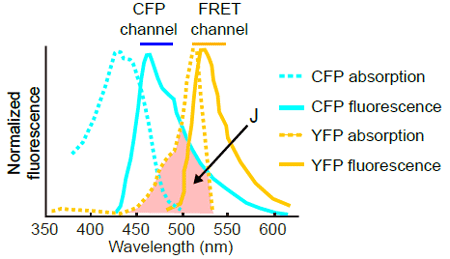
FRET, Förster (or fluorescence) resonance energy transfer, is a process by which a radiationless transfer of energy occurs from a fluorophore of a donor to that of an acceptor molecule in close proximity [1]. This process is usually accompanied by fluorescence from the acceptor molecule. In our project, we routinely use a pair of green fluorescent protein (GFP) mutants [2] we prefer to use a cyan-emitting mutant of GFP (CFP) and a yellow-emitting mutant of GFP (YFP). Fig3101 shows the FRET scheme between CFP and YFP. Excited CFP normally irradiates cyan fluorescence (left panel). If YFP is placed close to CFP, FRET occurs and fluorescence from YFP is observed (right panel). It should be remembered that, in the case of Gflourescent proteins, the donor and acceptor must be placed within 5 nm of each other for FRET to be detectable. Since some 20 kDa globular proteins have diameters of 5 nm, presence of FRET is almost identical to direct contact between CFP and YFP.
|
|
|
Fig3101 |
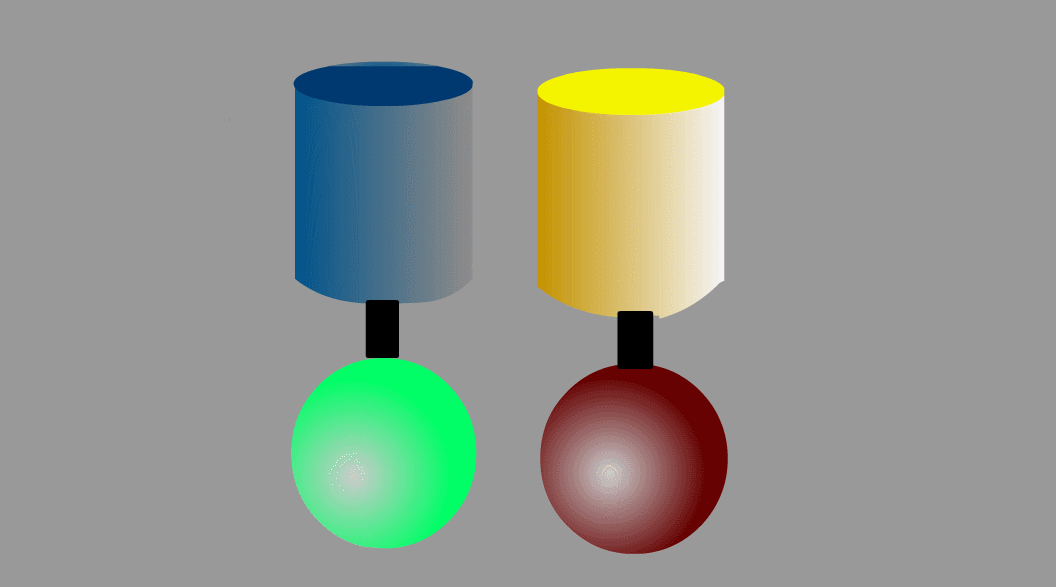
FRET can be applied to detect protein-protein interaction of the intracellular signaling molecules. Fig3201 illustrates an example in which a green protein binds to and dissociates from a brown protein. After the green protein is labeled with CFP and the brown with YFP, we can monitor the complex formation by quantitating FRET efficiency, which can be calculated by measuring the fluorescence intensities of YFP and CFP. This intermolecular FRET probe has some flaws in its application to in vivo imaging. First, it is difficult to introduce equal amounts of YFP- and CFP-fusion proteins into a single cell. Second, the YFP-fusion protein and CFP-fusion proteins usually have different subcellular distribution. The unevenness of YFP- and CFP-fusion proteins forces researchers to correct the properties of filters equipped in the fluorescence microscope. Third, expression of the signaling molecules competes, to a greater of lesser extent, with the authentic signal transduction cascades.
|
|
Fig3201 |
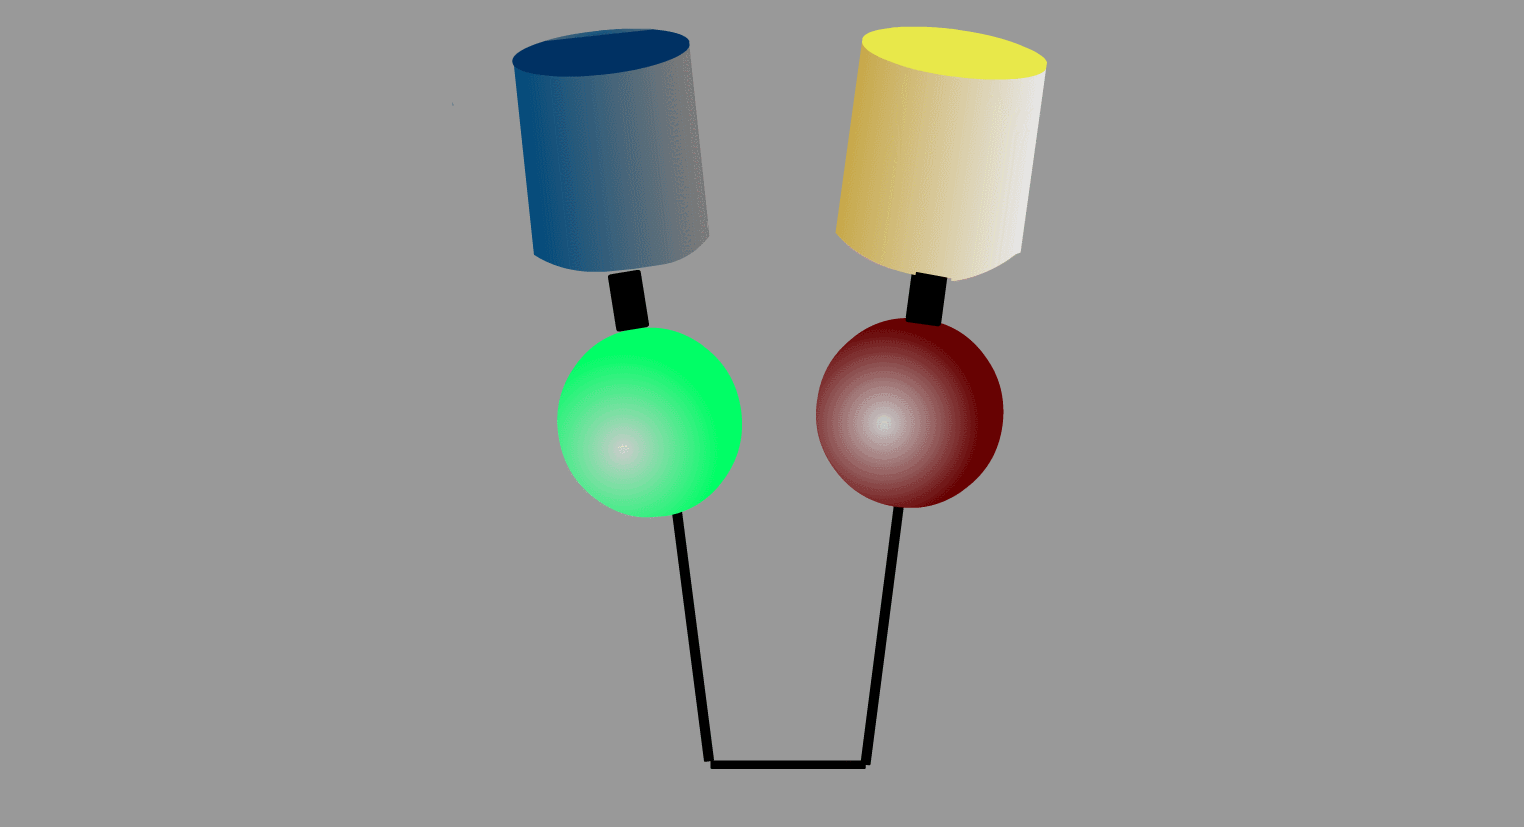
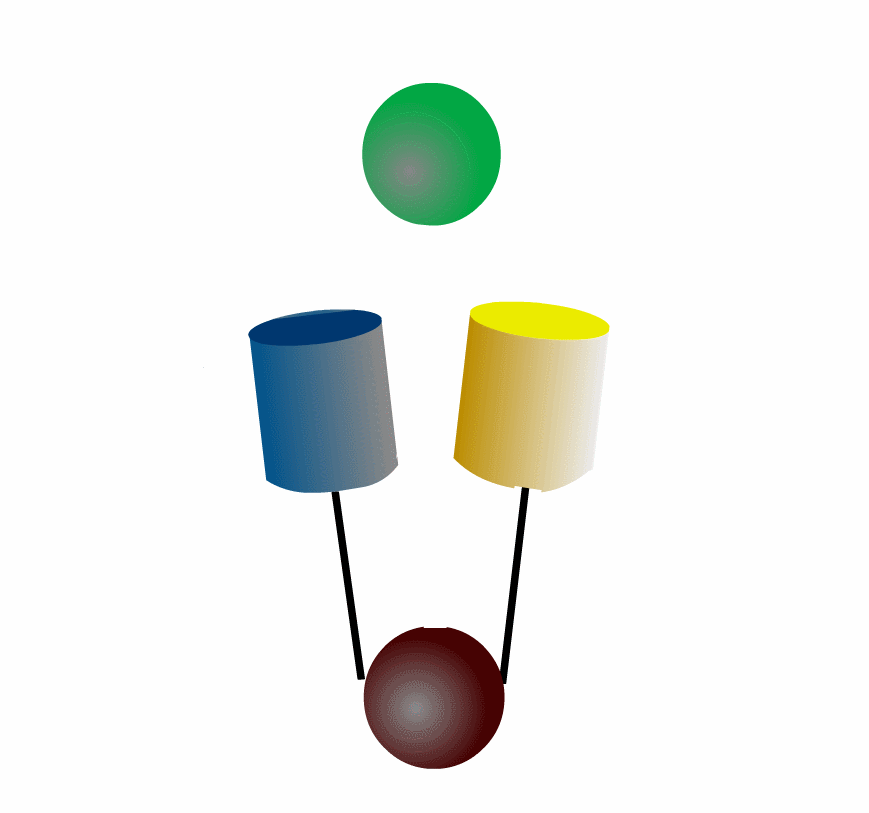
To overcome the flaws of the intermolecular FRET system, the two proteins can be fused to make an intramolecular FRET probe as shown in Fig3202. This approach is also useful for the detection of conformational change in a single protein. The largest defect in this intramolecular FRET system, however, is the difficulty of positioning the fluorophore and the proteins so that external stimuli change the FRET efficiency. A simpler version of the intramolecular FRET probe is shown in Fig3203. In this type of probe, only one protein of the binding pairs is fused to YFP and CFP. Binding of the fusion protein to the other partner protein dissociates YFP and CFP, decreasing FRET efficiency. This method is superior in that we need to express only one of the binding pairs. A possible defect is that the association-induced change in FRET efficiency may not be large enough to enable the visualization of cellular signaling.
|
|
|
Fig3202 |
Fig3203 |
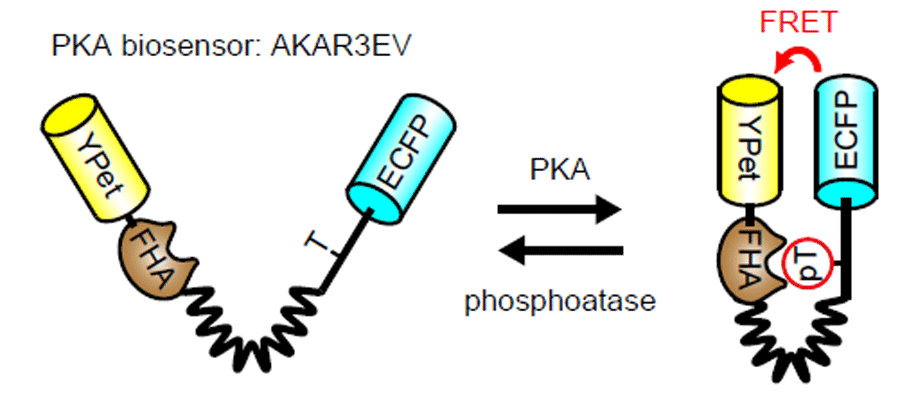
PHOGEMON is the name of intramolecular FRET probes (referred as FRET biosensors hereafter, which is getting more popular name among the community) developed in our laboratory. The basic structure of PHOGEMON, or the FRET biosensor, follows that of cameleon developed by Atsushi Miyawaki and Roger Tsien [6]. Cameleon consists of the calcium-binding domain of calmodulin and the calmodulin-binding domain of M13 protein, sandwiched between YFP and CFP. Similarly, the FRET biosensor consists of YFP, a sensor region, a ligand region, and CFP. Each domain is connected by spacer regions (Fig4103). Upon stimulation, the conformation of the sensor region is changed so that it binds to the ligand region. The possible pairs of sensor and ligand domains includes "G protein vs target molecule", "tyrosine-phosphorylation sites vs SH2 domains", and "threonine-phosphorylation sites vs WW domains".
|
|
Fig 4103 |
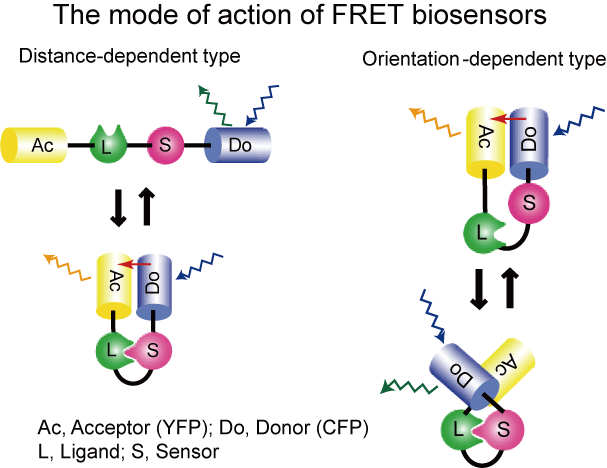
The FRET efficiency of the FRET biosensor is dependent primarily on the distance and the relative orientation of the donor and the acceptor. We call these two types of the FRET biosensor as "orientation-dependent�hand "distance-dependent" FRET biosensors, respectively (Fig4105). Although the �gorientation-dependent�h FRET biosensor may be able to exhibit higher sensitivity than does the �gdistance-dependent�h FRET biosensor, we could hardly predict and control the orientation of the donor and the acceptor for the development of an optimal FRET biosensor. This is because we usually do not know the three-dimensional structures of the biosensor of which the sensor domain is bound (�gON�h) and not bound (�gOFF�h) to the ligand domain.
|
|
Fig 4105 |
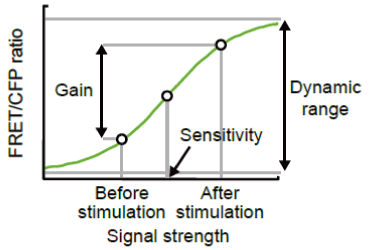
Gain and Dynamic Range: Before the evaluation of FRET biosensors described in this study, we will define the technical terms related to their performance. FRET is detected by the ratiometry: Cells are excited at a 440 nm wavelength, and the ratio of fluorescence intensity of the YFP channel (FRET) versus fluorescence intensity of the CFP channel (CFP), FRET/CFP, is used to represent the level of FRET-on state. Here, the �gdynamic range�h of the FRET biosensor is the theoretical range of FRET/CFP in the �gON�h state biosensor and that in the �gOFF�h state (Fig 4104).
|
|
Fig 4104 |
In practical use, the change of activity or concentration of the molecule is monitored by the change of FRET/CFP after stimulation. This �ggain�h of the FRET signal is the relative increase or decrease in FRET/CFP after stimulation and is expressed as a percentage of the FRET/CFP value before stimulation. Therefore, the �ggain�h of a FRET biosensor expressed in a certain cell type depends on both the �gdynamic range�h of the FRET biosensor and the increase in the fraction of the �gON�h state after stimulation versus that before stimulation. Meanwhile, �gsensitivity�h of FRET biosensors denotes a concentration of stimulants that increases FRET/CFP value to 50% of the �gdynamic range". For the detailed analysis, please refer to our recent paper [31] .
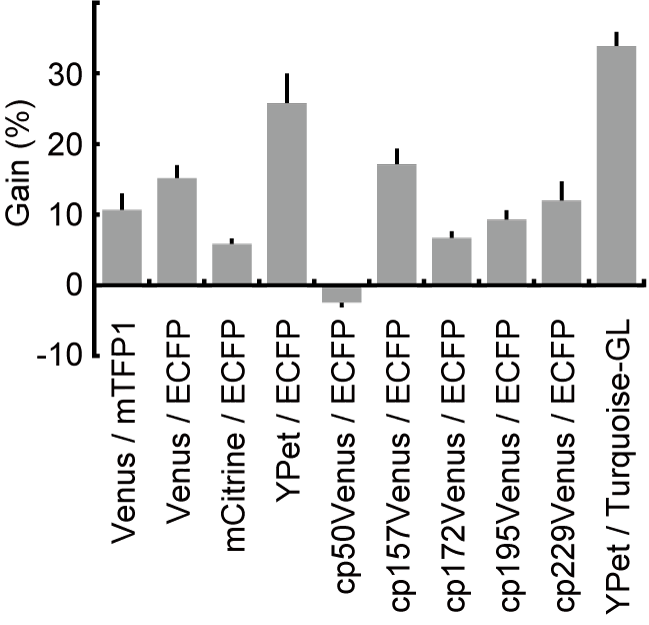
Currently, most genetically encoded FRET probes use CFP and YFP as the donor and the acceptor, respectively. We tried several combinations of donor and acceptor fluorescent proteins. flourescent proteins. As donor flourescent proteins, we tested teal fluorescent protein (TFP), a fluorescent protein derived from corral, and CFP-derived flourescent proteins, including ECFP, Turquoise, and CyPet, and as acceptor flourescent proteins, we examined YFP-derived flourescent proteins, including Venus, circularly-permutated Venus mutants, mCitrine, and YPet. Among them, the FRET biosensors containing Turquoise/YPet exhibited the largest gain in FRET/CFP. Notably, YPet did not show any superiority to Venus when TFP was used as the donor (Fig4106), suggesting that a pair of dimerization-prone flourescent proteins is suitable for distance-dependent FRET biosensor. Circular permutants may greatly improve the FRET/CFP efficiency. However, the mode of action may not be the change in the orientaion of fluorophore, as proposed originally. Recent data suggest that the conformational change of cp mutants by means of interaction may change the FRET/CFP ratio. Taken together, these results led us to conclude that the Turquoise-GL/YPet pair was suitable for the donor and acceptor pair of the distance-dependent intramolecular FRET biosensor. A pair of GFP and RFP is used in some studies, particularly those with two photon excitation microscopy. In our hands, however, we have not yet found any supeirority in the GFP-RFP pair to the CFP-YFP pair. We have recently found that Kusabira orange and mKate proteins work efficiently as the FRET pair in the long wavelength region (doi: 10.1021/acssensors.9b01941).
|
|
Fig 4106 |
Examples of the pairs of sensor and ligand domains are shown in Fig4107. Crystallographic data on the sensor and ligand proteins will help us to determine the minimum region to be incorporated in the FRET biosensor. We must emphasize, however, that even with such data on the protein complex, we have not been able to derive any principle on the optimal design of the FRET biosensor until now. The order of YFP, sensor, ligand, and CFP can be changed. Either the sensor or ligand region can be placed at the amino terminus, only if the association between the sensor and ligand regions changes FRET efficiency. Hahn and colleagues developed a Rho biosensor, in which CFP and YFP are tandemly connected and further sandwiched between RhoA and its effector protein. Because CFP and YFP are set in close proximity, the basal FRET level is usually quite high in this probe design.
Examples of Sensor and Ligand |
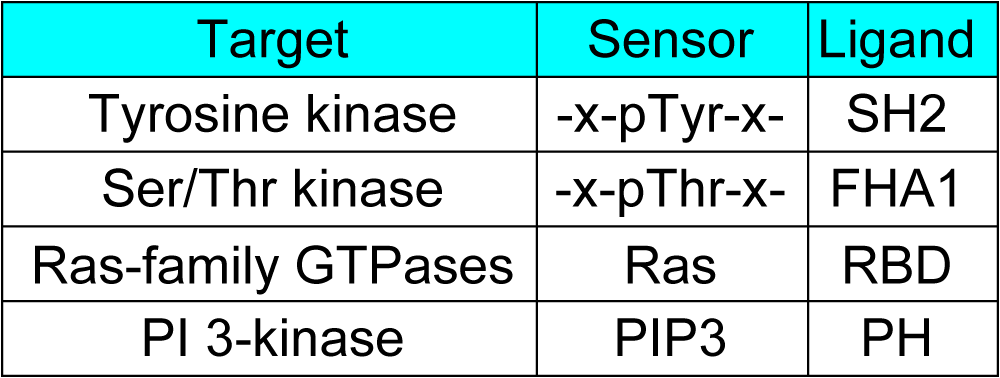 |
Fig 4107 |
Previously we showed that the basal GTP/GDP ratio of the Ras FRET biosensor was markedly larger than that of the endogenous Ras protein, implicating that the close proximity of the sensor and ligand domains could increase the proportion of FRET biosensors in the ON state [4]. This is probably because the ligand domain competitively inhibits access of GAPs to the biosensor. This observation urged us to lengthen the linker to reduce the proportion of ON state FRET biosensors. We prepared (SAGG)n linkers (n = 13 to 61) and inserted them into the prototype PKA biosensor. As expected, FRET/CFP in the absence of stimulation correlated inversely with the length of the linker (Fig4108). The gain of the FRET biosensors upon dbcAMP stimulation correlated with the length of the linker owning to the decrease in FRET/CFP in the absence of dbcAMP. With these data, we proposed an optimized backbone of FRET biosensors, which comprises of a dimerizatio-prone FRET pair such as YPet and CyPet and a long flixible linker named EV linker.
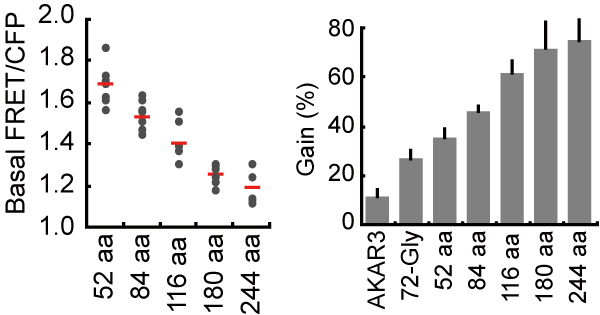 |
Fig 4108 |
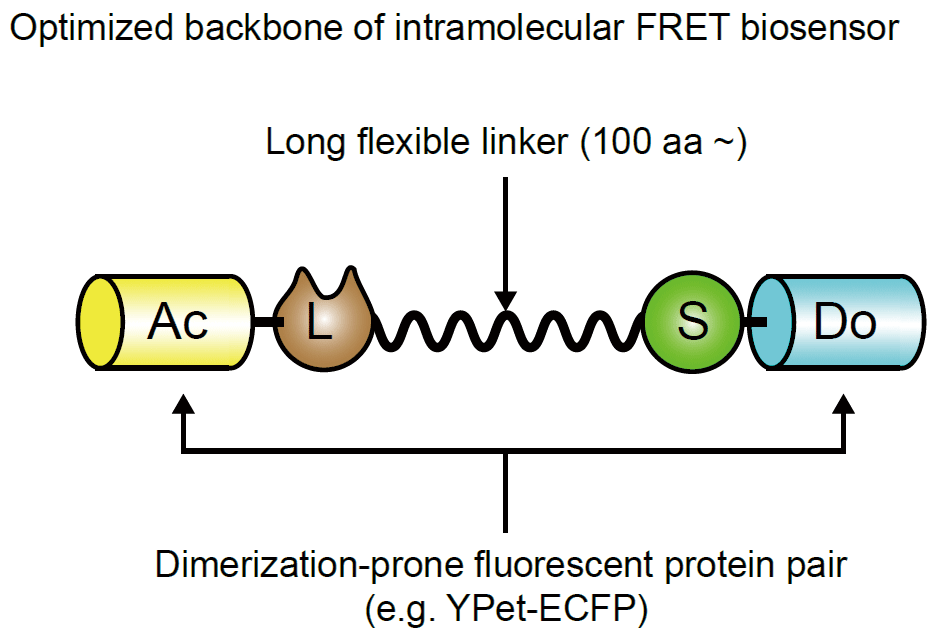 |
Fig 4109 |
It is extremely important to place the FRET biosensor at the proper intracellular localization. The largest defect of the FRET biosensor is its low signal-to-noise (S/N) ratio. This can be attributable mostly to the nature of the CFP-YFP FRET system, in which emission from CFP overlaps with that from YFP. So, even without any FRET (Fig. 4501), there is significant amout of bleed-through signal in the YFP channel. Therefore, excess of the biosensor greatly increases the background signal in the YFP channel and thereby decreases the S/N ratio, because the level of noise correlates with he amount of the probe.
|
| Fig4501 |
There are two possible ways to overcome this defect. The first method is the use of a confocal microscope, which can eliminate the fluorescence signal from none-focused regions. However, as we will discuss elsewhere, use of the confocal scanning laser microscopes is not recommended in most timelapse FRET experiments. The second method is elimination of the biosensor from the irrelevant regions. This is the reason that many FRET biosensors are targeted to specific subcellular regions.
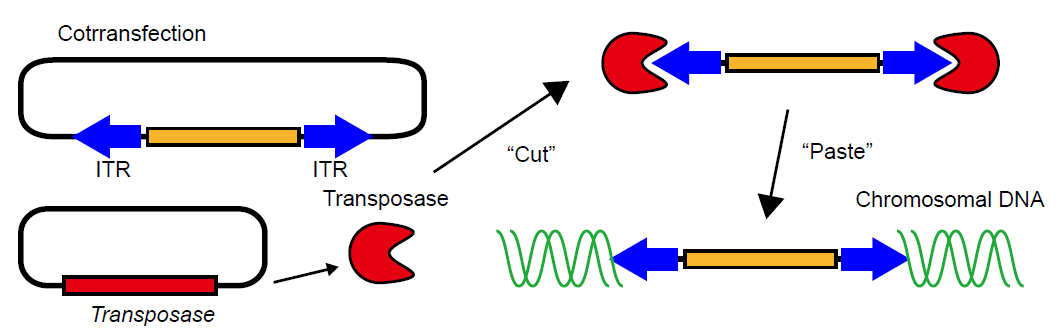
Plasmids: The second largest defect of current FRET biosensors was the lack of stable cell lines and transgenic mice. We found that use of transposase for the delivery of the cDNAs of FRET biosensor almost completely overcame these defects (Fig4110). Probably any of the tranoposon-mediated gene transfer systems will work. We have tested piggyBac [33] and Tol2 [32] work quite efficiently. Notably, current transoposase-mediated gene transfer systems are "reversible"; i.e., the integrated biosensor gene can be excised by the re-expression of transposase. Having two transposase-mediated gene transfer systems, we can stably express at least two different genes.
|
| Fig4110 |
We routinely use the expression plasmid containing the recommbination sequence of piggyBac for the FRET biosensor expression in tissue culture cells. The expression plasmids containing Tol2 recommbination sequence are used mostly for the generation of transgenic mice.
Cells: We routinely use 293F cells, which grow either in suspension or adhesion. After transfection of the expression plasmids, the FRET efficiency is monitored by FACS (FACS Aria, 408 nm). By the co-expression of activator or inactivator, or by the preincubation with stimulator or inhibitor, the gain of the FRET biosensor could be easily and quantitatively measured.
Following is our standard procedure for the development of the FRET biosensor. Please also read our published protocol. [34]
 |
| Fig 4801 |
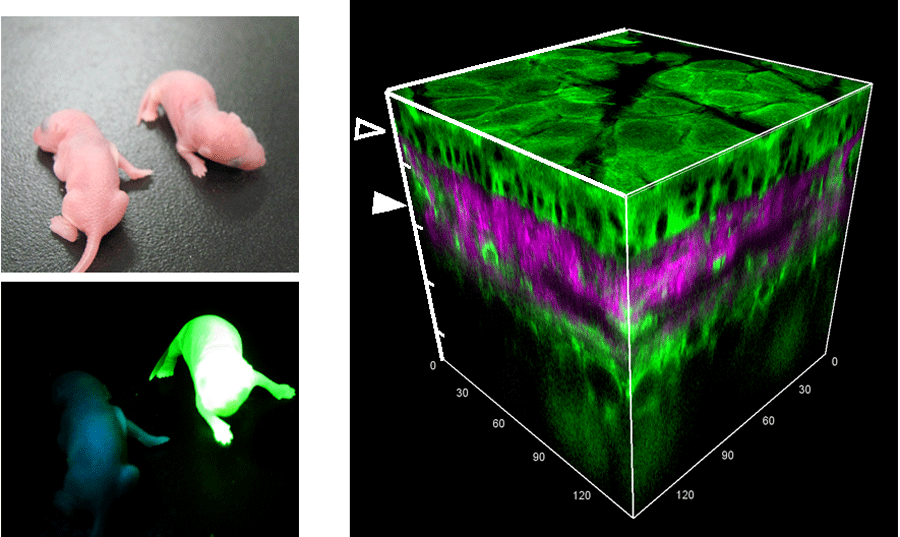
Transoposon-mediated gene transfer can accerelate the production of transgenic mice [35]. Furthermore, we found that the transposon-mediated gene transfer can also prevent recommbination between CFP and YFP during integration, enabling efficient production of transgenic mice expressing a FRET biosensor, which we call collectively as FRET mice [36]. With CAG promoer, the FRET mice are bright enough to be screened under UV light at birth (Fig 4801, left). The ear skin is the easiest for observatoin under two-photon excitation microscopes. We can see all layers of the mouse ear tissue (Fig. 4801, right). For the intravital imaging of mouse, you should refer to other protocols. Briefly, we place an anesthesized mouse under the microscope and observe with a upright two-photon excitation microscope (Olympus IX81-FV1000, Spectra Physics Mai-Tai DeepSee) (Fig 4802).
"Raichu" is an acronym that stands for Ras and interacting protein chimeric unit. Raichu monitors the activity of Ras family G proteins [4]. For details, click here.
Raichu-RalA is a probe designed to monitor the activity of RalA [30]. For details, click here.
Raichu-RRas is a probe designed to monitor RRas activity in the endosomal compartment; RRas is responsible for RalA activation via Rgl2/Rlf [25].
Following Raichu-Ras and Raichu-Rap1, we have developed Raichu-Rac1, Raichu-CRIB, and Raichu-CRIB-X [18]. For details, click here.
Raichu-RhoA is a probe designed to monitor the activity balance between GEFs and GAPs. Raichu-RBD monitors the level of endogenous GTP-RhoA [20]. . For details, click here.
Raichu-TC10 is a probe designed to monitor TC10 activity. TC10 is active in the endosomal vesicles and inactivated just before the vesicle fusion at plasma membrane [22].
Raichu-Rab5 is a probe designed to monitor Rab5 regulation of vesicle fusion of early endosomes and phagosomes. [31].
"Picchu" stands for Phosphorylation indicator of Crk chimeric unit [7]. For details, click here.
"Prin", which stands for Photometric Raf indicator, is a probe designed to monitor the conformational change of Raf proteins, cRaf and BRaf [27, 28]. For details, click here.
"Miu2", which stands for MAPK indicator unit ERK2, is a probe designed to monitor the conformational change of ERK2 MAP kinase [29].
"Akind", which stands for Akt indicator, is a probe designed to monitor the conformational change of Akt [26].
 |
| Fig 4106 |
We call FRET biosensors containing the EV linker collectively as "Eevee", which stands for Extension for enhanced visualization by evading extra-FRET [31]. By the application of the EV linker the sensitivity of AKAR (PKA sensor), JNAKAR (JNK sensor), EKAR (ERK sensor) etc. was greatly increased. Furthermore, we could generate biosensors of PKC, Akt, S6K, and RSK with much less effort than the previously-developed probe.
"Pippi", which stands for Phosphatidylinositol phosphate indicator, is very similar to Fllip, a monitor for PIP3, which was elegantly designed by Umezawa and colleagues [23]. By substituting the ligand domain, we now have biosensors for PIP3, PI(3,4)P2, PI(4,5)P2, and PI(4)P [24, 26]. For details, click here.
 |
|
Fig 6101 |
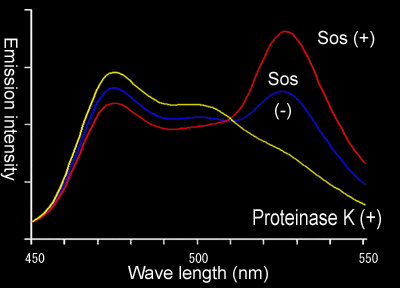
Usually, excitation of YFP at 433 nm does not hamper the interpretation of the results. However, when the expression level of CFP is low, you may mistake the signal from YFP excited at 433 nm as a sign of FRET. This can be easily excluded by the following method.
Because flourescent proteins are exceptionally resistant to proteinases, if you treated the recombinant proteins fused GFP with proteinases, it will be cleaved only at the sites outside of Gflourescent proteins. So, after the PK treatment of the FRET biosensor, you will obtain free YFP and CFP. If the fluorescence of YFP disappears after proteinase K treatment, this confirms the presence of FRET (Fig 6101, yellow line).
We no more use the following method, which has been replaced by the method 6-1.
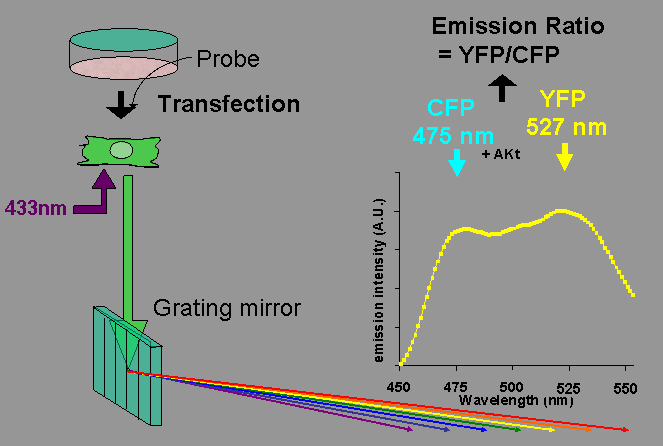
During the course of probe development, we sometimes noticed a discrepancy between the FRET efficiency obtained from imaging data and the FRET efficiency as analyzed by spectrometer in vitro as described above. Please remember that we are detecting the conformational change of the probe by measuring the FRET efficiency. By lysing the cells, we are probably losing proteins that interact weakly with the probe, which may affect the FRET efficiency in the cells but not in the lysate. To overcome this situation, we can use imaging spectrofluorometry, which enables us to acquire the spectrogram of a single cell. Cells were imaged on an inverted microscope equipped with a flat-field imaging spectrograph, SpectraPro 150 (Acton Research, Acton, MA), a Spec-10:256E cooled CCD camera, and inSpec32 software (Roper Scientific, Trenton, NJ). A region on the cell covering all or part of the probe-expressing cell is determined. The fluorescence is separated into a rainbow through a grating mirror, and this fluorescence spectrum is recorded by the CCD camera.
 |
| Fig 6301 |
Complete darkness is not required. However, a fluorescence lamp on the ceiling will increase the background. Another reason that we recommend the use of a dark room is that keeping a good focus for a long time is critical for obtaining good video data. While you are accumulating data, it is essential that you not let anyone touch your microscope.
We use Olympus IX81 inverted epifluorescence microscopes equipped with a ZDC autofocus system and an XY motor drive. This autofocus system has become an essential tool, because it allows us to follow multiple cells during routine time-lapse experiments. For example, if you wish to follow cytokinesis by taking images every 10 min for 1 or 2 days, you can easily follow dozens of cells by using the autofocus system and the XY motor drive.
We use LED as the light source. Considering the lifetime of arc lamps, LED is more ecconomical than Xenon or Hg arc lamp.
To observe cell morphology, either phase contrast (PH) or differential interference contrast (DIC) must be applied. Note that you will lose some percentage of fluorescence by the phase ring equipped with the objective lens for PH. When you use athe DIC system, the polarizer can be set either in the emitter wheel changer or in the filter cube just below the objective lens. The former is desired when a quick change of the filter is essential, but this comes at the expense of the reduced image quality.
|
| Fig7501 |
We used to use a chamber to cover most of the microscope. However, after the introduction of ZDC autofocusing system, we now use a small chamber for most experiments. For accurate temperature control, you may also need t lens heater.
The CCD camera is getting cheaper, but still a CCD camera is one of the most expensive parts of the data imaging system. Reading textbooks on the principles of CCD cameras will save you a lot of money, as you will be better able to avoid overspending on a camera with specifications you don't need. We have been using a CoolSNAP HQ (Roper Scientific) for more than ten years for routine FRET imaging. A CCD camera with an on-chip intensifier is useful for TIRF etc. However, for most routine experiments, such a high sensitivity camera is over-spec, because autofluorescence of the cells is the limiting factor of S/N of FRET imaging. Recently, we have replaced some of HQ's with K4, which has a wider CCD chip and allows imaging of whole viewfield. /P>
 |
| Fig 7701 |
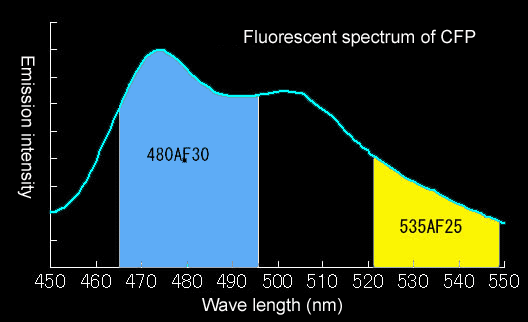
We use 440AF21 (XF1071) for excitation, 455DRLP (Omega Optical., Brattleboro, VT) for dichroic mirror, 480AF30(XF3075) for CFP, and 535AF26(XF3079) for YFP. A 6% - 12% ND filter is usually used so as to prevent photobleaching.
We use MetaMorph (Universal Imaging; Sunnyvale, CA). All imaging systems require the image processing software to acquire the images. In addition, you probably need to have PCs installed with standalone software. Following is a brief procedure for the analysis of FRET images.
|
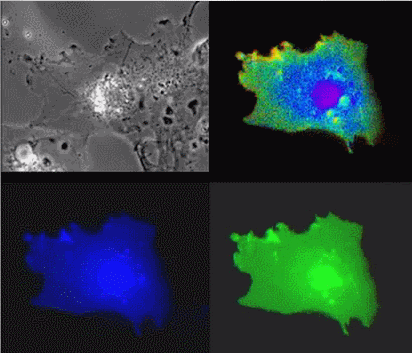
| Raichu-Ras: Upper left, phase contrast; lower left, CFP; lower right, YFP; upper right, FRET |
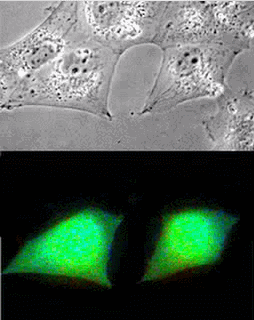
Imaging of Picchu in COS1 cells: mov8201.mpeg Upper panel, phase contrast; lower panel, FRET
|
| Picchu: Top, phase contrast; Bottom, FRET |
This research is supported by the Ministry of Education, Culture, Sports, Science, and Technology (MEXT), Japan.
Department of Bioimaging and Cell Signaling, Graduate School of Biostudies & Pathology and Biology of Diseases, Graduate School of Medicine, Kyoto University